Introduction
In this tutorial series, you will learn how to use a Raspberry Pi Zero to display the current temperature on a ws2812b 32x8 LED matrix in Python.
In Part 3, we will design the glyph sprites and display them on ws2812b 32x8 LED matrix.

Design the glyph sprites:
- The glyph representing the weather condition from the API.
- Retrieve the weather data from OpenWeather.
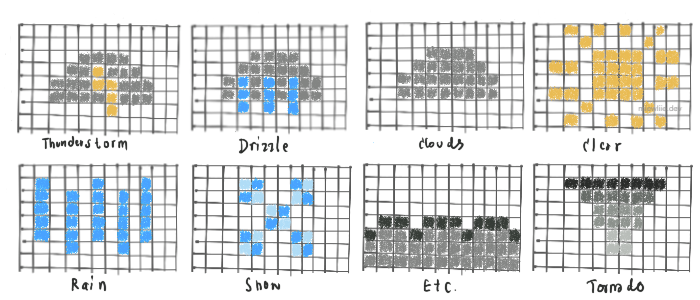
- Create each sprite using an 8x12 matrix, as shown in the example below.

- Based on the design shown above, the width of the glyph sprite is 12 and the height is 8 (which is the maximum height of the ws2812b LED matrix). Similarly to the previous tutorial, you can adjust the width, design, and color of the glyph sprite as you like.
Apply all sprites into (x,y) coordinates:
- To get started, let’s create a new file called
glyph_coordinate.pyinside the~/display/coordinatedirectory. - Inside
glyph_coordinate.py, create nested dictionaries containing weather conditions and their corresponding glyph sprite coordinates. For each weather condition, add one or more color codes as keys and the corresponding (x,y) coordinates as values.
coordinate/glyph_coordinate.pyweather = { 'Clouds': { (255, 255, 255): [(2, 4), (2, 5), (3, 3), (3, 4), (3, 5), (4, 2), (4, 3), (4, 4), (4, 5), (5, 2), (5, 3), (5, 4), (5, 5), (6, 2), (6, 3), (6, 4), (6, 5), (7, 2), (7, 3), (7, 4), (7, 5), (8, 3), (8, 4), (8, 5), (9, 4), (9, 5)] }, 'Drizzle': { (255, 255, 255): [(2, 4), (2, 5), (3, 3), (3, 4), (3, 5), (4, 2), (4, 3), (4, 4), (4, 5), (5, 2), (5, 3), (5, 4), (5, 5), (6, 2), (6, 3), (6, 4), (6, 5), (6, 6), (7, 2), (7, 3), (7, 4), (7, 5), (8, 3), (8, 4), (8, 5), (9, 4), (9, 5)], (0, 0, 205): [(2, 6), (3, 5), (4, 4), (4, 6), (5, 5), (6, 4), (6, 6), (7, 5), (8, 4)] }, 'Etc': { (30, 30, 30): [(0, 5), (1, 4), (2, 4), (3, 5), (4, 4), (5, 4), (6, 4), (7, 5), (8, 4), (9, 4), (10, 4), (11, 5)], (54, 54, 54): [(0, 6), (0, 7), (1, 5), (1, 6), (1, 7), (2, 5), (2, 6), (2, 7), (3, 6), (3, 7), (4, 5), (4, 6), (4, 7), (5, 5), (5, 6), (5, 7), (6, 5), (6, 6), (6, 7), (7, 6), (7, 7), (8, 5), (8, 6), (8, 7), (9, 5), (9, 6),(9, 7), (10, 5), (10, 6), (10, 7), (11, 6), (11, 7)] } }
I’ve provided three examples above. For more glyph sprites, feel free to create them yourself and try different colors and designs to make the display more visually appealing.
Etcwill represent all other weather conditions in API Group 7xxx (Atmosphere), except for Tornado which will have its own representation.
Design a sprite class:
- We will create a new class called
ColorfulSpriteby modifying thesprite_painter.pycode used for the Monochrome sprite. - Copy and paste the code below into the existing
sprite_painter.pyfile.
lib/sprite_painter.pyclass ColorfulSprite(NamedTuple): width: int """Width of the sprite""" height: int """Height of the sprite""" layers: dict[Color: list[tuple[int, int]]] """The list of pixels representing the sprite""" def draw_colorful_sprite( pixels: Pixels, sprite: ColorfulSprite, position: tuple[int, int], color: Color ): for color, color_pixels in sprite.layers.items(): draw_pixels(pixels, position, color_pixels, Color(*color))
The ColorfulSprite will draw layer by layer as we set the color for each glyph coordinate.
Test the glyph display:
- To make the necessary changes, open the
temperature.pyfile and modify it as shown below.
display/temperature.pyfrom lib.pixels import * from lib.sprite_painter import * from coordinate.num_coordinate import numbers from coordinate.glyph_coordinate import weather def draw_temp(pixels, temp_celsius): """ Draw monochrome temperature, degree symbol, and minus sign if necessary. """ temp_celsius = temp_celsius + 'c' for i in range(0, len(temp_celsius)): sprite = MonochromeSprite(height = 8, width = 6, pixels = numbers[temp_celsius[i]]) ## The first sprite starting point of the x-axis is 0. The next sprite ## will be positioned after the previous one. position_x = i * 6 ## The starting point of the y-axis is always 0 for a 32x8 matrix. position_y = 0 draw_monochrome_sprite(pixels, sprite, (position_x, position_y), Color(0, 0, 200)) def draw_wcondition(pixels, w_condition): """ Draw colorful weather condition glyph. """ ## You can check the API documentation for a list of weather conditions. ## If you are using OpenWeather like me, you should have the same list as shown below. etc_glyph_set = {'Mist', 'Smoke', 'Haze', 'Dust', 'Fog', 'Sand', 'Ash', 'Squall'} w_condition = 'Etc' if w_condition in etc_glyph_set else w_condition sprite = ColorfulSprite( height=8, width=12, layers=weather[w_condition] ) ## For the glyphs of weather conditions, I set starting location of the x-axis at position 20. ## The initial color will be overridden at the 'draw_colorful_sprite' method. position_x = 20 position_y = 0 draw_colorful_sprite(pixels, sprite, (position_x, position_y), Color(255, 0, 0)) if __name__ == '__main__': pixels: Pixels = Pixels() ## Later, we will obtain this data from an API. temp_celsius, weather_condition = ['-8', 'Snow'] draw_temp(pixels, temp_celsius) draw_wcondition(pixels, weather_condition) pixels.show()
- After you add all glyph coordinates, modify
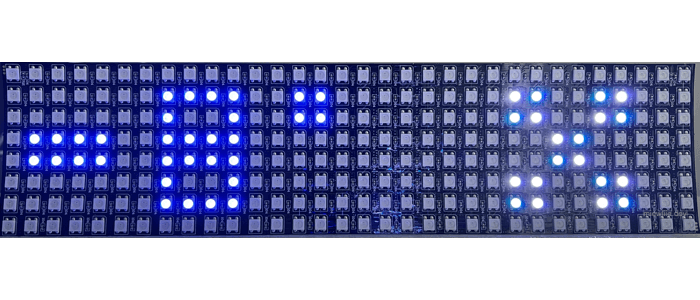
temperature.pyand runsudo python temperature.py. You should get a similar result to the image below.

Cool!
** Part 4 💻