Introduction
In this tutorial series, you will learn how to use a Raspberry Pi Zero to display the current temperature on a ws2812b 32x8 LED matrix in Python.
In Part 4, we will retrieve data from the OpenWeather API, display the temperature and weather condition glyph, and set up a cron job to trigger temperature.py every hour.

Integrate with the OpenWeather API.
- Sign up and subscribe to the Free API to obtain an API key.
- Update
temperature.pyto retrieve data from the API. - For more information, please refer to the API documentation.
display/temperature.pyimport math import requests from lib.pixels import * from lib.sprite_painter import * from coordinate.num_coordinate import numbers from coordinate.glyph_coordinate import weather API_KEY = 'Put your OpenWeather API key here' ## Your preferred location LAT = Your latitude LON = Your longitude ## I exclude all of this except 'current', please check API document. PART = 'minutely,hourly,daily,alerts' url = f'https://api.openweathermap.org/data/3.0/onecall?lat={LAT}&lon={LON}&exclude={PART}&appid={API_KEY}&units=metric' def get_weather(): """ Request weather data. Return current temperature and current weather condition """ response = requests.get(url) data = response.json() temp_celsius = data['current']['temp'] weather_condition = data['current']['weather'][0]['main'] return temp_celsius, weather_condition def draw_temp(pixels, temp_celsius): """ Draw temperature, degree symbol, and minus sign if necessary. """ ## the API return temperature in float format. So, I converted to string before using it. temp_celsius = str(math.floor(temp_celsius)) # if temperature is one digit or two digit I want to add space in front of it. if len(temp_celsius) == 1 or len(temp_celsius) == 2: temp_celsius = ' ' + temp_celsius temp_celsius = temp_celsius + 'c' for i in range(0, len(temp_celsius)): sprite = MonochromeSprite(height = 8, width = 6, pixels = numbers[temp_celsius[i]]) # Adjust a place to start drawing the first sprite. The next sprite # will be positioned after the previous one. position_x = i * 6 + (-1 if len(temp_celsius)-1 == i else 0) position_y = 0 ## the starting point of y axis is always 0 for 32x8 matrix draw_monochrome_sprite(pixels, sprite, (position_x, position_y), Color(0, 0, 200)) def draw_wcondition(pixels, w_condition): """ Draw colorful weather condition glyph. """ ## You can check the API documentation. If you are using OpenWeather like me, ## you should have the same list below. etc_glyph_set = {'Mist', 'Smoke', 'Haze', 'Dust', 'Fog', 'Sand', 'Ash', 'Squall'} w_condition = 'Etc' if w_condition in etc_glyph_set else w_condition sprite = ColorfulSprite( height=8, width=12, layers=weather[w_condition] ) ## For the glyphs of weather condition, I set started location of x axis at position 20. ## The initial color will be overide at draw colorful sprite method. position_x = 20 position_y = 0 draw_colorful_sprite(pixels, sprite, (position_x, position_y), Color(255, 0, 0)) if __name__ == '__main__': pixels: Pixels = Pixels() temp_celsius, weather_condition = get_weather() ## temp_celsius, weather_condition = ['-8', 'Snow'] ## Clean up the display before draw the new one pixels.clear() pixels.show() draw_temp(pixels, temp_celsius) draw_wcondition(pixels, weather_condition) pixels.show()
Adjust the design as you prefer:
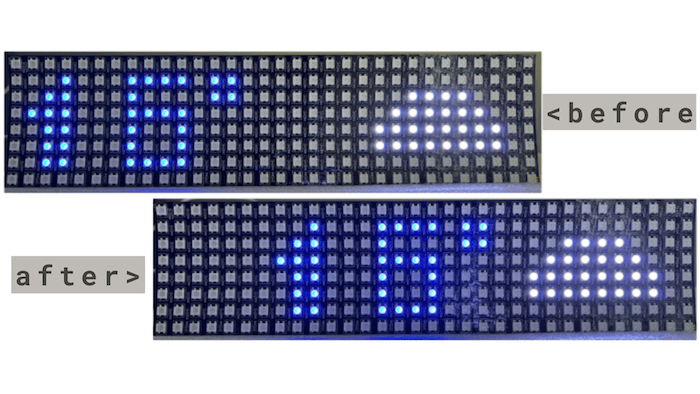
- I want to add some space in front of the temperature if it is a single digit number (0 - 9 only), followed by a ‘c’ symbol. To achieve this, I need to add ‘ ‘: [] in
coordinate/num_coordinate.py.

Set a cron job/trigger to run every hour:
- Open the crontab file by typing crontab -e in the terminal. The crontab file contains commands that will automatically execute
temperature.pyat the specified time defined by the first five fields of each command. Read more about crontab here. - Add the following line to the crontab file:
0 * * * * sudo python ~/display/temperature.py. - To retrieve new temperature data every hour, we need to set up a cron job that triggers
temperature.pyat the specified interval.
Now we are finished!
Good job! See you in the next project 🥳