Introduction
In this tutorial series, you will learn how to use a Raspberry Pi Zero to display the current temperature on a ws2812b 32x8 LED matrix in Python.
In Part 2, we will design the number, minus sign, and degree symbol sprites and display them on ws2812b 32x8 LED matrix.

Design the sprite:
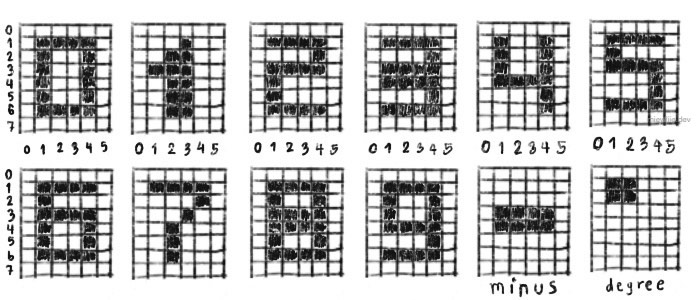
- We will start by designing each number, minus sign, and degree symbol on an 8x6 matrix. You can use any tools to help with drawing.
- Additionally, we will design the minus sign character in case the temperature is lower than zero degrees.
- For more consistency, we will include space around the numbers and characters, as shown in the example below.

- From the above design, the width is 6 and the height is 8 (this is the maximum height of the board, but for the width, you can adjust it as you like).
Apply all sprites into (x,y) coordinates:
- We will start by creating a directory to keep all the coordinates.
raspberrypissh pi@IP ## ssh into Raspberry Pi

cd display

mkdir coordinate ##create draw directory

cd coordinate

touch num_coordinate.py ## create file
- Inside
num_coordinate.py, let’s create dictionaries that store each number as a key and the value as thexandycoordinates. You can refer to the example above.
coordinate/num_coordinate.pynumbers = { '0': [(1, 1), (1, 2), (1, 3), (1, 4), (1, 5), (1, 6), (2, 1), (2, 6), (3, 1), (3, 6), (4, 1), (4, 2) ,(4, 3), (4, 4), (4, 5), (4, 6)], '1': [(1, 3), (2, 2), (2, 3), (2, 4), (2, 5), (2, 6), (3, 1), (3, 2), (3, 3), (3, 4), (3, 5), (3, 6)] }
I will give examples for
0and1. For other numbers, you can try it yourself.
Design a sprite class:
Let’s create
sprite_painter.pyinside thelibdirectory.As we are designing with one color for numbers, we will call it
MonochromeSpriteclass.
lib/sprite_painter.pyfrom lib.pixels import * from typing import NamedTuple class MonochromeSprite(NamedTuple): width: int """Width of the sprite""" height: int """Height of the sprite""" pixels: list[tuple[int, int]] """The list of pixels representing the sprite""" def draw_pixels( pixels: Pixels, position: tuple[int, int], pixel_list: list[tuple[int, int]], color: Color ): """ Start at position x, y and draw sprite with given list of x, y coordinate with color provide """ for pixel in pixel_list: x, y = pixel pos_x, pos_y = position x = pos_x + x y = pos_y + y pixels.set(x, y, color) def draw_monochrome_sprite( pixels: Pixels, sprite: MonochromeSprite, position: tuple[int, int], color: Color ): """ Draw a sprite with one color """ draw_pixels(pixels, position, sprite.pixels, color)
- In the previous tutorial, we created
red_dot.py, but this time we will createtemperature.pyinside thedisplaydirectory.
display/temperature.pyfrom lib.pixels import * from lib.sprite_painter import * from coordinate.num_coordinate import numbers if __name__ == '__main__': pixels: Pixels = Pixels() number = '0' for i in range(0, len(number)): sprite = MonochromeSprite(height = 8, width = 6, pixels = numbers[number[i]]) position_x = i * 6 ## the starting point of first sprite at y axis will start at 0, ## and the next sprite will start after the previous one. position_y = 0 ## the starting point of y axis is always 0 for 32x8 matrix draw_monochrome_sprite(pixels, sprite, (position_x, position_y), Color(255, 0, 0)) pixels.show()
- Then, run
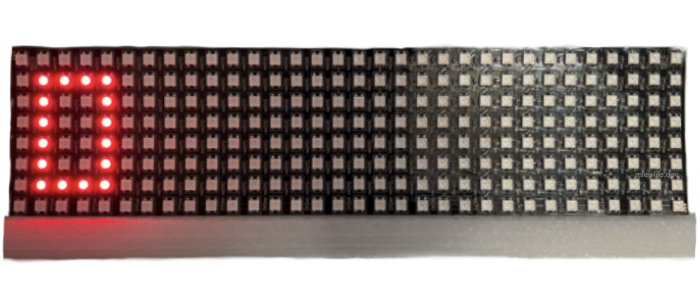
sudo python temperature.pyand check the result.

- After you have added the coordinates of all sprites inside
num_coordinate.py, you can try it out with a number like15cor a different RGB color like(0, 255, 0)and play around with it. You should get a similar result as the first image in this tutorial. Good luck and have fun!
** Part 3 💻